The impact of armed conflict on the labour market of the eastern cities of Ukraine
Mariupol, Kramatorsk, Sloviansk, Pokrovsk, Bakhmut, Lysychansk, Starobilsk
Socio-economic situation at the beginning of the crisis period
Before the conflict in the east, Donetsk and Luhansk region played a significant role in the Ukrainian economy: in the pre-crisis 2013 Donbas produced 14.5% of the gross regional product in total. The population of the region was 6,6 million, which is equivalent to 14.6% of the population of the state. Instead, in 2015, according to the State Statistics Service, Donetsk and Luhansk regions (without taking into account the zone of the anti-terrorist operation) together produced only 7% of the gross regional product. The industry, that employed a quarter of Donbas population, decreased by approximately 58% in Donetsk and 82% in the Luhansk region. During the conflict period, almost two million jobs were lost in the Donbas.
Prior to the conflict, the economic activity of the region was consistent with the average indicators of the labour market in general in Ukraine. However, with the onset of the conflict in 2014, the situation in the Donbas labour market has deteriorated significantly. Three years after the start of the conflict, the situation remains difficult, despite the fact that official statistics are calculated only for areas under the control of the Ukrainian authorities.
| Indicator1 | Period2 | Donetsk region | Luhansk region | Ukraine |
| Economic activity rate | 2012 | 66% | 63% | 65% |
| 2014 | 61% | 59% | 62% | |
| 2016 | 58% | 66% | 62% | |
| The level of economic inactivity | 2012 | 35% | 38% | 35% |
| 2014 | 39% | 41% | 38% | |
| 2016 | 42% | 34% | 38% | |
| Employment rate | 2012 | 60% | 59% | 60% |
| 2014 | 54% | 52% | 57% | |
| 2016 | 50% | 56% | 56% | |
| The unemployment rate | 2012 | 8% | 6% | 8% |
| 2014 | 11% | 11% | 9% | |
| 2016 | 14% | 16% | 9% |
1Source: State Statistics Service.
2Data for 2016 is given without considering the area of the anti-terrorist operation.
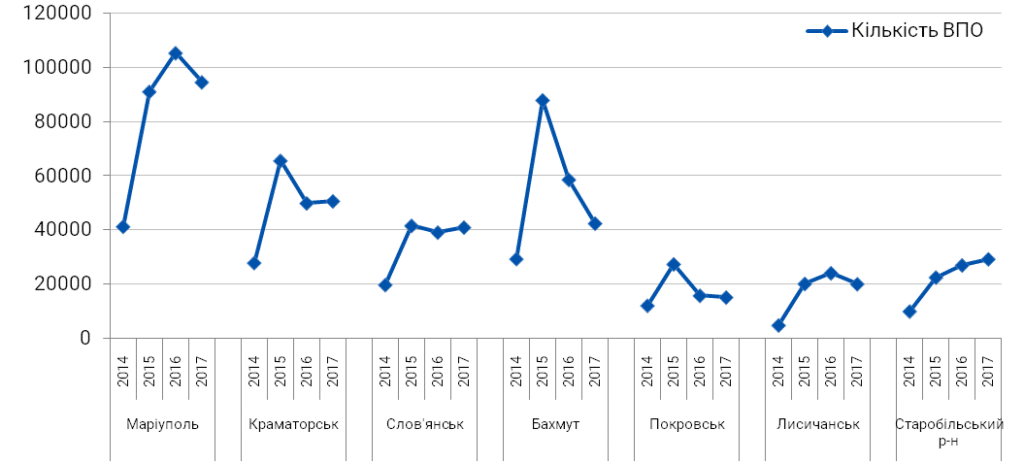
Immediately after the conflict, a significant number of people left the territories covered by the conflict. Thus, according to the estimates by the Ministry of Social Policy, by the end of August 2015, 1.46 million internally displaced persons were registered, half of them (759 thousand persons) moved to the territories of Donbas under Ukrainian control, simultaneously creating significant pressure on the social infrastructure and local labour markets. For some of the studied cities, the number of registered migrants was one-fifth of the population of the city in 2015 (Mariupol - 20%, Bakhmut - 19%).
Fig. 1. Dynamics of the number of registered internally displaced persons city-wise3 (data for 2017 as of December 2017)
3Source: Department of Social Protection of the Luhansk Region State Administration, Department of Social Protection of the Donetsk Region State Administration.
After four years from the beginning of the conflict, the number of registered IDPs in all cities has either slightly decreased or stabilized at a certain level. However, the data should be used with caution due to the shortcomings in the methodology, since the displaced often registered with the nearest social department while moving, and could not be re-registered after further migration within the country or upon returning to the uncontrolled territories.
Fig. 2. Socio-demographic structure of registered internally displaced persons4 (data for 2017 as of December 2017)
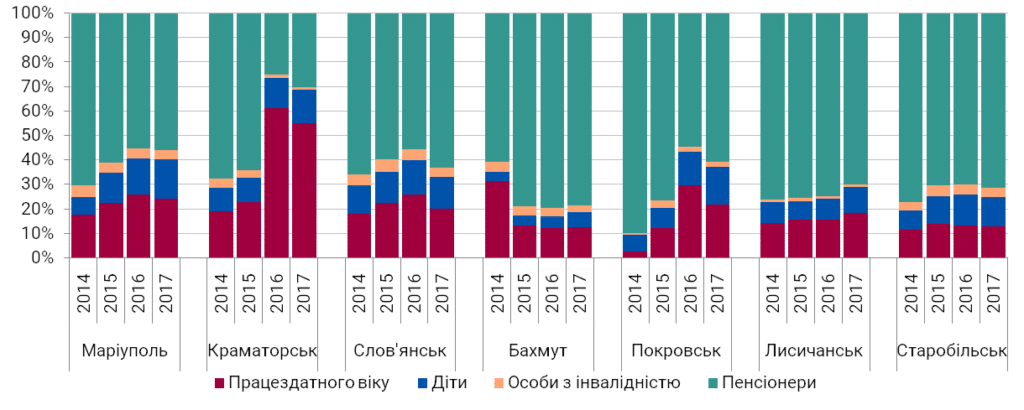
It is also worth noting that registered IDPs of working age who could theoretically influence the supply of labour in the local markets accounted for a relatively small (up to 25%) share among all registered IDPs in the cities under consideration. The only exception was Kramatorsk, where the proportion of the able-bodied IDPs increased to half of all registered migrants in 2016.
To assess the potential impact of IDPs on regional labour markets, it is advisable to compare the ratio of the displaced in the region and the number of economically active population (the population that is working or is ready to work). However, the number of economically active population is not monitored at the city level; therefore, for such an assessment, the comparison of the number of registered IDPs in 2015 (the number of IDPs for most cities was at highest then) and the total urban population before the outbreak of the conflict.
Fig. 3. Evaluation of load changes in local labour markets of the selected cities through internal population displacement5

4Source: Department of Social Protection of the Luhansk Regional State Administration, Department of Social Protection of the Donetsk Regional State Administration.
5Source: Department of Social Protection of the Luhansk Regional State Administration, Department of Social Protection of the Donetsk Regional State Administration, State Statistics Service, author's calculations.
According to the official data, even relatively large increases in labour supply due to the movement of a large number of the IDPs for labour markets were not as tangible in relatively large cities (Mariupol, Kramatorsk and Sloviansk) as in the smaller front-line cities (Bakhmut). However, the statistics may be misleading, as IDPs were often registered with authorities in settlements close to the collision line, and then moved to the cities with better employment conditions and were not re-registered. This suggests that potential labour market pressure, that is calculated on the statistical data, is overestimated for the cities that are closer to the conflict line and underestimated for comparatively large cities.
It should be noted that the employment structure in Donetsk and Luhansk regions in 2012 corresponds to the structure of employment of parts of Ukrainian-controlled Donetsk and Luhansk regions' territory according to the branches of the economy, which can testify to the ability of the labour markets in these territories to integrate displaced persons from the uncontrolled territories (see the Attachments below).
The war in the east, of course, had a negative impact on the state of the labour markets in the region, but this influence was uneven, so it is advisable to analyse in more detail how the situation on the labour markets of the small post-industrial cities has changed in nearly 4 years of the conflict and what factors are crucial for improving the employment conditions.
The current situation in the labour markets of the selected cities
To analyse the changes in supply and demand in 2013-2017 in the cities of eastern Ukraine, the data from the State Employment Service and popular job search sites were used, since these are the only comparable sources of detailed information at the city level. Despite the fact that the State Employment Service (SES) classifies the unemployed with a number of features (such as age, gender, education, the previous field of work, etc.), not that many unemployed people are using it. The number of unemployed according to the International Labour Organization (ILO) methodology (non-working people, including informally, those who were looking for work and ready to start work) is on average about one-sixth bigger than the number of the registered unemployed.
Fig. 4. Changes in the number of the unemployed according to the ILO methodology and the unemployed registered in State Employment Service6
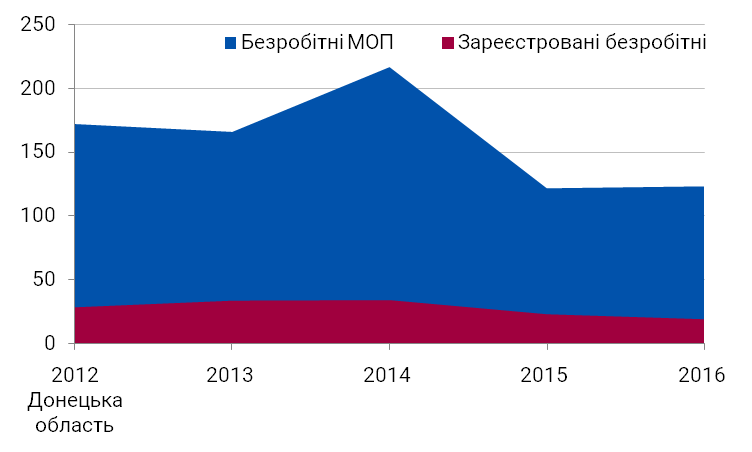
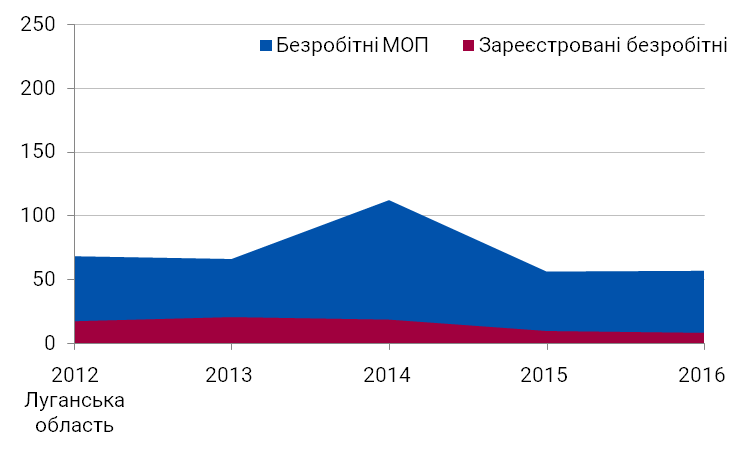
The ILO study showed that economically active IDPs often are not registered because they believe that the State Employment Service offers low-paying vacancies that do not correspond to the speciality of the unemployed. Instead, some categories of population (for example, those without Internet access or the experienced workers that do not wish to interrupt their work experience) have a greater motivation to register with the State Employment Service and rarely use job search sites. Therefore the juxtaposition of ratios calculated based on data from the two sources is justified.
Job offer
According to the analysed data, women on average use the services of the State Employment Service more often. Among the registered unemployed, women in all of the cities, with the exception of Starobilsk, make up more than a half of the registered unemployed, and this tendency was traced back to the beginning of the conflict (see the Attachments below). The high proportion of women among the registered unemployed can be explained by the fact that women are often looking for more stable employment in the public sector7.
6Source: Donetsk Regional Employment Centre, Luhansk Regional Employment Centre, State Statistics Service.
7Kupets, O. V. Features of The Unregistered Unemployment in Ukraine. NaUKMA Scientific Notes. Economics 133 (2012): 89-94.
The analysis of data from the job search sites has shown that men in the selected cities more often than women place their resumes on job search sites, which is corresponding to the higher level of economic activity of men than women. Among the job seekers at the job search sites, the youth prevails in almost all of the cities and, usually, makes up less than a quarter of all registered unemployed in the Employment Offices of the selected cities (see the Attachments below). A small number of people in need of employment that are registered with the State Employment Service can be explained by low wages. In the first half of 2017, the average wage offered was 3789 UAH in Donetsk region and 2928 UAH in Luhansk region, which did not significantly exceed the minimum wage established by the state. At the same time, the average desirable level of remuneration at the end of 2017 on job search sites varied from 7000 to 9000 UAH depending on the city (it should be noted that only half of the CVs contained information on the desired level of remuneration).
Demand for labour
Analysis of the State Employment Service data shows that not many employers register vacancies with the SES. This may be due to the fact that employment services are used by the less competitive and therefore less skilled workers. However, the impact of the conflict on the number of vacancies recorded by the SES at the end of the year varies significantly from city to city. In such cities as Bakhmut, Lysychansk and Starobilsk, the number of registered vacancies has increased in 2016 compared to the pre-crisis 2013, and in Kramatorsk, Pokrovsk, Mariupol and Sloviansk - has decreased (see the Attachments below).
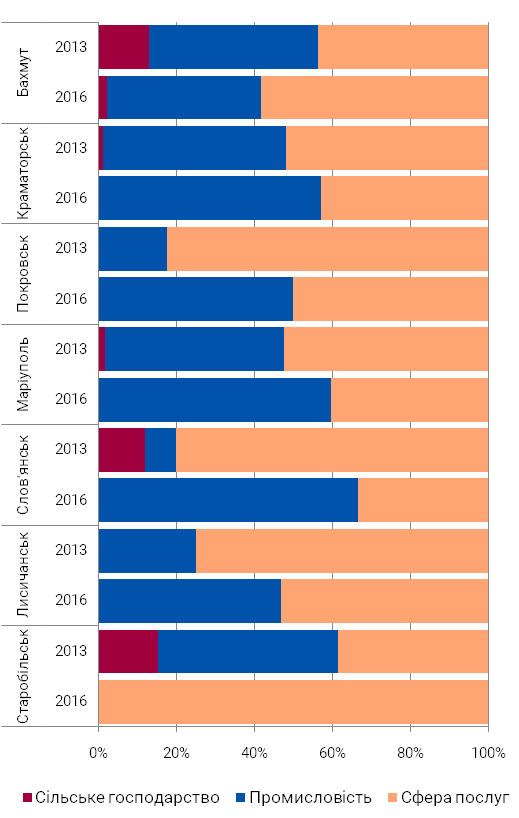
According to official SES data, the largest number of vacancies in almost all the cities (with the exception of Starobilsk district, where the least vacancies were found) were registered in the processing industry. Despite the fact that in 2016 the number of vacancies in this area decreased in almost all cities, it continues to play an important role in employment in the region. In addition, after the conflict began, the share of registered vacancies was redistributed to such areas as wholesale and retail trade; repair of motor vehicles and motorcycles in such cities as Bakhmut, Mariupol, Sloviansk; government and defence in Bakhmut, Pokrovsk; education and health care in Mariupol, Sloviansk, Lysychansk, Starobilsk (see the Attachments below). This, on the one hand, shows the fact that vacancies of state organizations are more often registered at the State Employment Service, and on the other hand, shows that demand for labour in the public sector was less sensitive to the reduction of economic activity in cities.
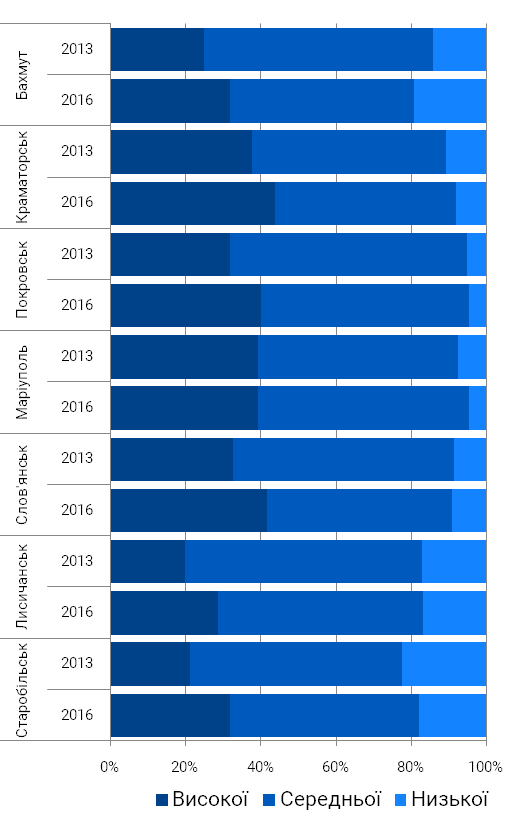
Most vacancies registered with the SES require a medium or low qualification. Vacancies for skilled workers with equipment, workers in maintenance, operation and technical process control, assembly of equipment and machinery, as well as employees of the simplest professions accounted for about half of the registered vacancies in such cities as Bakhmut, Mariupol and Sloviansk, and in Kramatorsk and Starobilsk - except for some periods, when the demand for workers in trade and services has risen episodically. In most cities, the vacancies for workers with higher education were at best a quarter, with the exception of Pokrovsk, where the share of such vacancies reached 40% in some years.
The ratio of vacancies and the unemployed
According to the SES, the ratio between the registered unemployed and vacancies has decreased from 25 people per vacancy in 2014 to 18 in 2017 in Donetsk region, and from 101 people per vacancy in 2014 to 18 in 2017 in the Luhansk region. The reduction in the burden of the unemployed per vacancy was due to a reduction in the number of registered persons in all the studied cities. The number of registered vacancies remains fairly low in all cities, and the tendency to labour demand increase is rather weak. The reduction in the burden per vacancy coincides with the decrease in the registered number of able-bodied migrants, which may indicate that internally displaced persons moved to cities with better employment opportunities.
| City | Year | Number of registered unemployed, total9 | Vacancies | Unemployed per job vacancies |
| Bakhmut | 2013 | 1553 | 23 | 68 |
| 2015 | 1256 | 41 | 31 | |
| 2017 | 718 | 84 | 9 | |
| Kramatorsk | 2013 | 2199 | 85 | 26 |
| 2015 | 1855 | 27 | 69 | |
| 2017 | 1122 | 24 | 47 | |
| Pokrovsk | 2013 | 405 | 17 | 24 |
| 2015 | 653 | 5 | 131 | |
| 2017 | 303 | 14 | 22 | |
| Mariupol | 2013 | 3786 | 270 | 14 |
| 2015 | 5241 | 83 | 63 | |
| 2017 | 2734 | 74 | 37 | |
| Sloviansk | 2013 | 1550 | 25 | 62 |
| 2015 | 1835 | 3 | 612 | |
| 2017 | 950 | 8 | 119 | |
| Lysychansk | 2013 | 2265 | 4 | 566 |
| 2015 | 927 | 18 | 52 | |
| 2017 | 907 | 114 | 8 | |
| Starobilsk | 2013 | 513 | 13 | 39 |
| 2015 | 610 | 3 | 203 | |
| 2017 | 478 | 44 | 11 |
9Source: Donetsk Regional Employment Centre, Luhansk Regional Employment Centre, author's calculations.
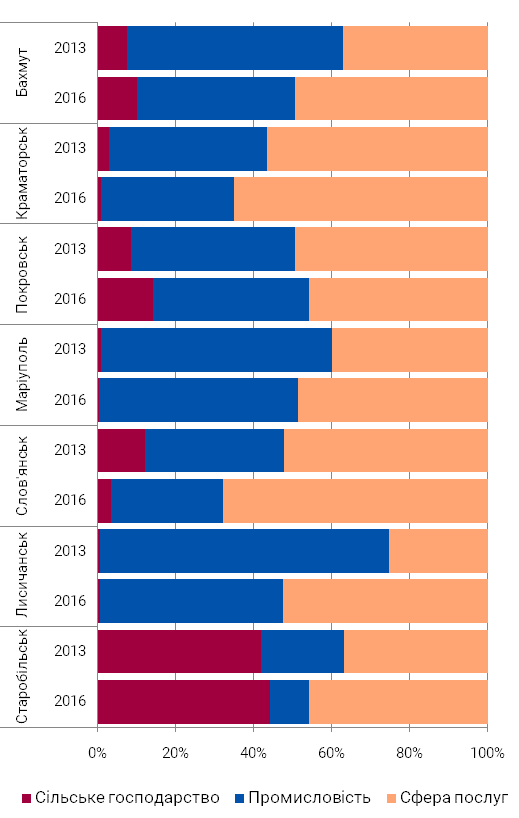
In 2016, compared to pre-crisis 2013, the share of unemployed people who had previously worked in industry has decreased, while the share of unemployed who were employed in the services sector has increased. The demand for labour in the industry remains crucial in all cities except Lysychansk and Starobilsk (Luhansk region), where during this period the number of registered vacancies in the field of public services increased (in particular, in such areas as education and healthcare).
Fig. 5. The sectoral structure of registered unemployed and vacancies10 (graph on the left - labour supply, on the right - demand for labour11)
10Sources: Donetsk Regional Employment Service, Luhansk Regional Employment Service, author's calculations.
11The Agriculture corresponds to section A, Industry - to sections B-F, Service Sector - to sections G-U CEA-2010 (Classifier of economic activities).
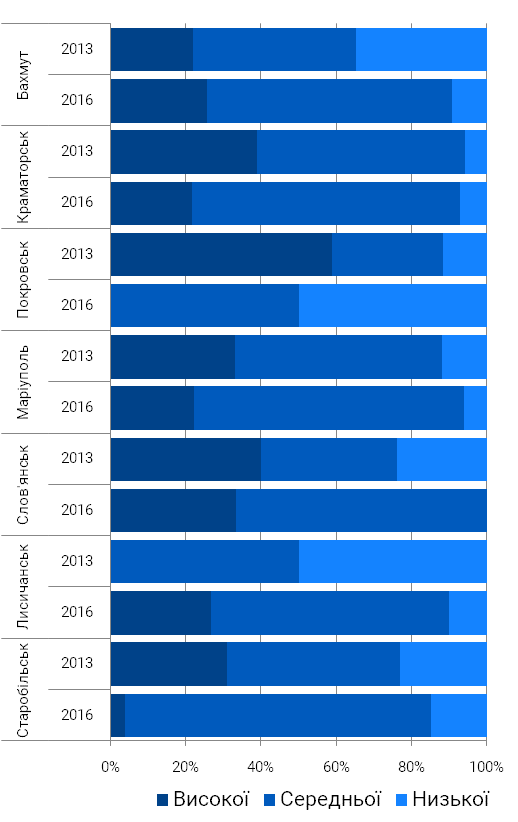
In 2013-2016, the professional mismatch between the labour supply and labour demand has increased. In all cities, the share of the unemployed people belonging to highly skilled workers has increased, while there are more vacancies that require middle-level qualified workers now. This may indicate the existence of the structural unemployment when the skills of the unemployed do not meet the current needs of local economies.
Fig. 6. The sectoral structure of registered unemployed and vacancies12 (graph on the left - labour supply, on the right - demand for labour13)
12Source: Donetsk Regional Employment Service, Luhansk Regional Employment Service, author's calculations.
13Professions of high qualification correspond to 1-3 grades, average - 4-8 grades, low - 9 grades ISCO 88.
In order to compare the data of the State Employment Service with the data of the job search sites, the content analysis of sites was conducted. As one employer could post vacancies on several sites, we have chosen only the most popular site for further analysis, the one that does not allow creating several identical vacancies. According to his data, the load on one vacancy in cities was lower (with the exception of Lysychansk) than on the data of the SES. On the one hand, it suggests that the employers tend to use alternative channels for employee search (including the Internet) in cities like Kramatorsk, Mariupol, Sloviansk and Pokrovsk. On the other hand, a large number of the registered unemployed in comparison with the amount of CVs on the job search site may indicate that the registered unemployed persons do not actively seek employment.
| City | Registered unemployed per vacancy14 | CVs per one vacancy on the site |
| Sloviansk | 118.8 | 4.6 |
| Kramatorsk | 46.8 | 4.2 |
| Mariupol | 36.9 | 4.3 |
| Pokrovsk | 21.6 | 4.5 |
| Starobilsk | 10.9 | 3.0 |
| Bakhmut | 8.5 | 5.6 |
| Lysychansk | 8.0 | 10.1 |
14Source: the content analysis of job search sites, author's calculations.
In order to understand what vacancies are in demand in local labour markets, the names of vacancies and CVs were analysed and merged into the following professional groups.
| Professional group | The share of ads15 | Share among vacancies | Load on the vacancy |
| Sales Managers | 21% | 27% | 3.4 |
| Top managers, executives | 9% | 5% | 7.6 |
| Client Work Specialists, administrators | 6% | 4% | 6.8 |
| Drivers | 5% | 4% | 6.7 |
| Accountants | 4% | 5% | 3.6 |
| Engineers | 4% | 4% | 4.5 |
| Secretaries, office managers | 3% | 1% | 14.1 |
| Guards | 3% | 3% | 12.1 |
| Cashiers | 3% | 3% | 2.4 |
| Economists | 2% | 0% | - |
| Teachers, instructors | 2% | 3% | 3.1 |
| Programmers | 2% | 1% | 9.3 |
| Electricians, Electromechanics, Installators | 2% | 2% | 4.7 |
| Lawyers | 2% | 1% | 6.8 |
Sellers-consultants, sales managers and sales representatives were the most sought after group of workers in the labour market of selected cities at the end of 2017. The job offer among these professionals was also the highest. Among other professions that were both in demand and represented by employees at the market, were top managers, customer service specialists, accountants, engineers, cashiers, drivers. Among the jobseekers at the job search sites, there were a lot of economists, lawyers, and office managers, while there was no demand, probably due to market saturation. The demand and supply of programmers were lower than expected, probably due to the fact that specialists in this category use narrowly professional job search sites. It should be noted that the data from the sites indicate a high demand for skilled workers (including electricians, electromechanics, electrical contractors, auto locksmiths, car mechanics) and a low supply of labour from this category of workers. Data on cities should be treated with caution, as the sites reflect the current need for workers. At the same time, in the cities such as Bakhmut, Pokrovsk, Starobilsk and Lysychansk, relatively few vacancies and CVs were registered on the sites.
15Source: the content analysis of job search sites, author's calculations.
Conclusions and recommendations
Local authorities and the public sector have a limited impact on unemployment, which is due to the dis-balance of the skills of workers and the needs of employers. However, the actions of local authorities and public activists may be aimed at better informing about the situation on the local labour market and opportunities in related labour markets. In particular, it is necessary to promote the activities of the State Employment Service by increasing its efficiency as an intermediary in the labour market. To improve access to information on vacancies among people of all ages, increasing the computer literacy of the unemployed and providing unhindered access to the Internet (for example, in city libraries). However, for small labour markets, like in Sloviansk, Bakhmut, Pokrovsk, Starobilsk, and Lysychansk, raising the awareness about a relatively limited number of vacancies can not significantly affect the likelihood of employment. For the unemployed of the small towns it is important to have access to the labour markets of other cities, which is impossible without convenient long-distance transport connections.
Retraining of the unemployed and changing the speciality to fill the actual vacancies requires significant resources: both material and time. Moreover, the employers are often looking for workers with experience. Given this, it is important to estimate the medium-term needs of local labour markets and the active involvement of major employers to staff training. According to local experts, and their assumptions voiced during the expert interviews, training on self-presentation and job search skills can positively affect the employment of residents of the selected cities.
The city authorities can indirectly influence unemployment that is caused by a decline in economic activity, through the full or partial involvement of local contractors in the execution of works financed from the local budget. Also, the expert interviews have shown that under the low economic activity conditions in the region, the decisive factor for the restoration of production capacities, and thus the improvement of the conditions of employment, is the search for new partners and consumers, including outside the region and abroad. Local authorities can help to find new ties by organizing communication platforms. In addition, the access to international markets requires special knowledge and expertise, so it is important for an entrepreneur to be able to receive professional advice on a range of legal, marketing and financial issues, which in turn can be provided by professional associations and civic organizations.
Attachments
Fig. 1. The structure of employment in the Donetsk and Luhansk regions before and after the beginning of the armed conflict
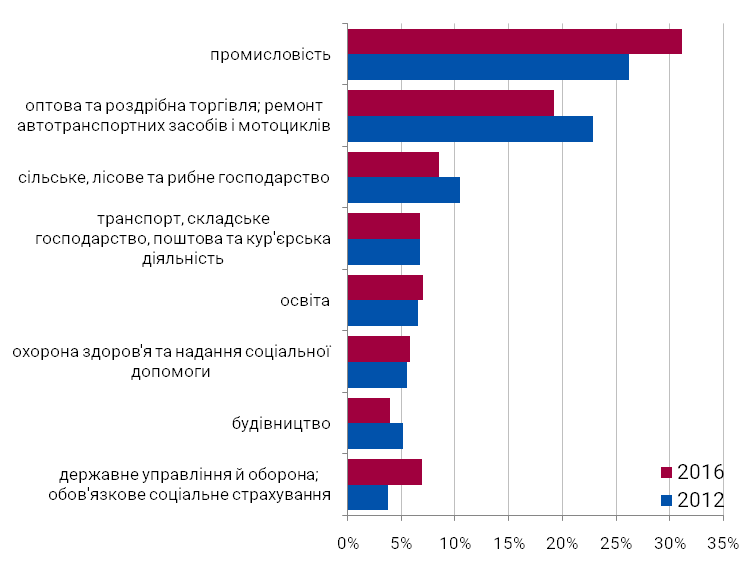
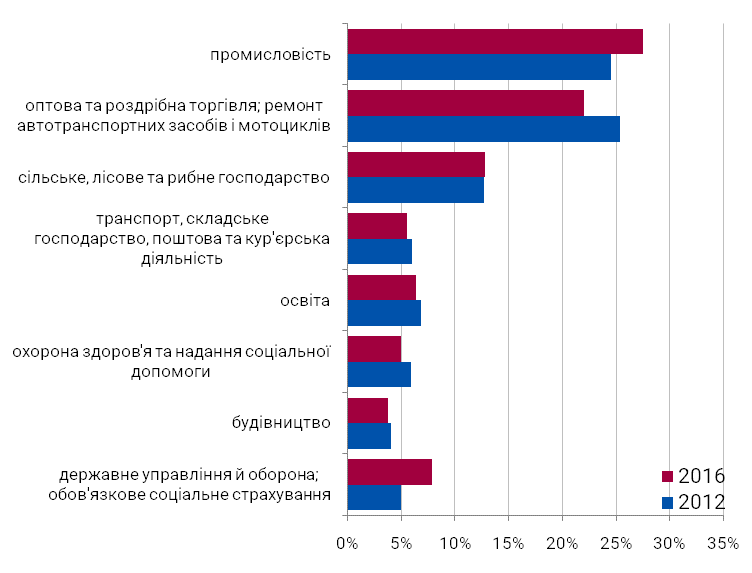
Fig. 2. The dynamics of the age structure of the registered unemployed, 2013-2016
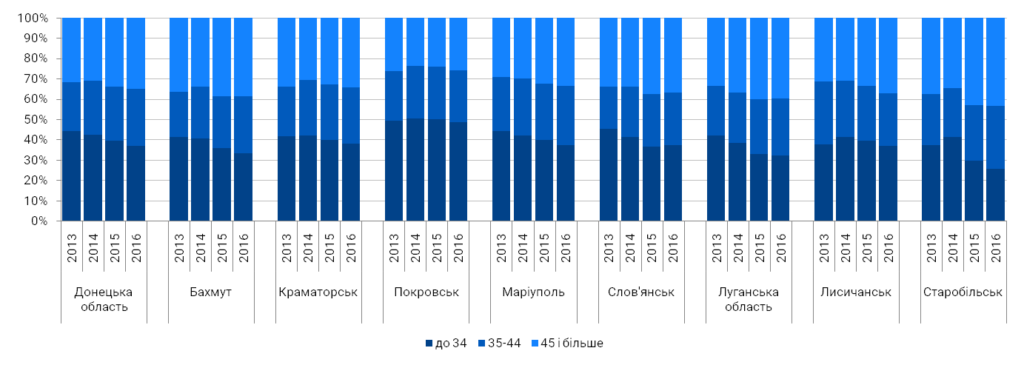
Fig. 3. The age structure of the registered unemployed and the job seekers through job search sites by the end of 2017
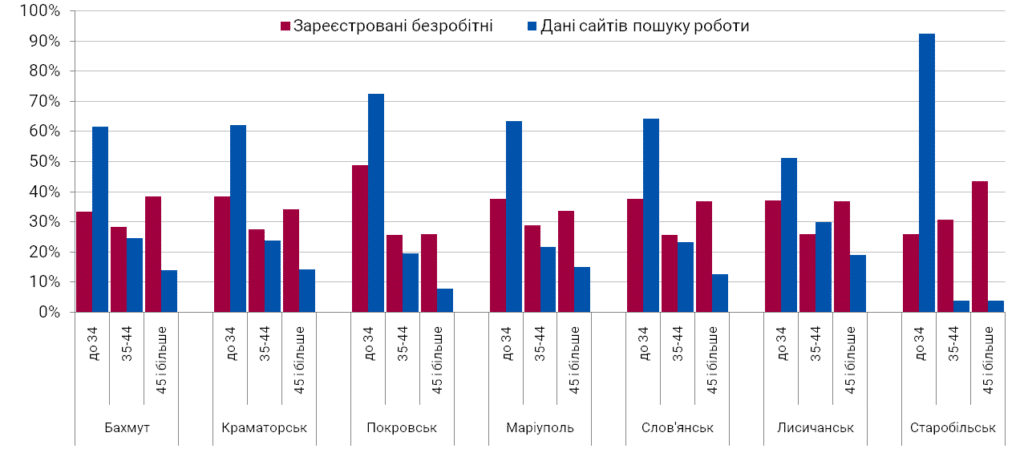
Fig. 4. The dynamics of the gender structure of the registered unemployed, 2013-2017
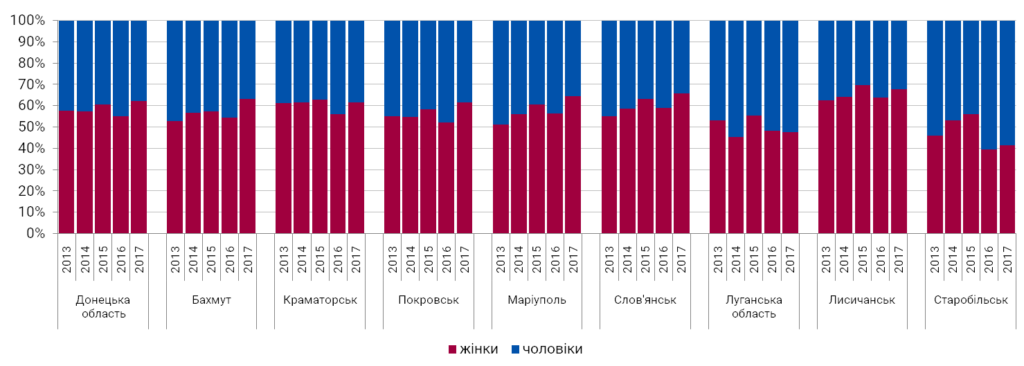
Fig. 5. Gender structure of the registered unemployed and the job seekers using job search sites, as of the end of 2017
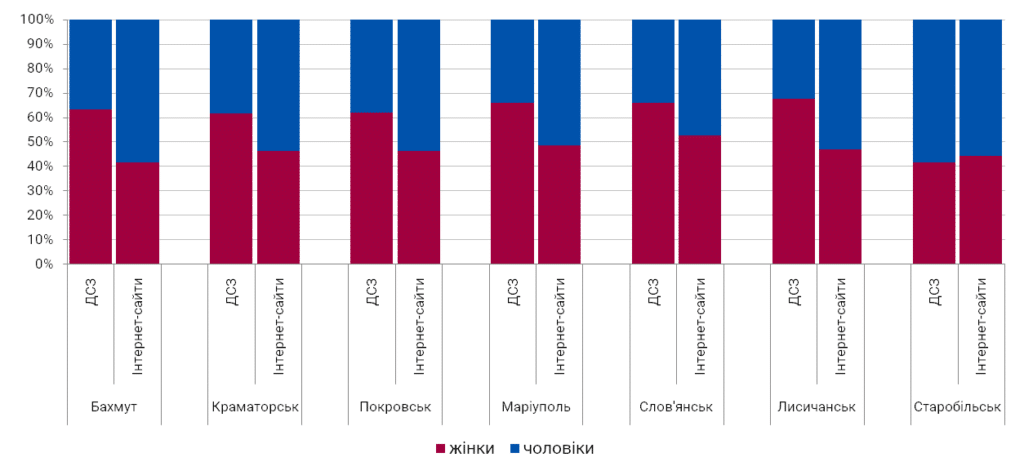
Fig. 6. The dynamics of the professional structure of the registered unemployed, 2013-2016
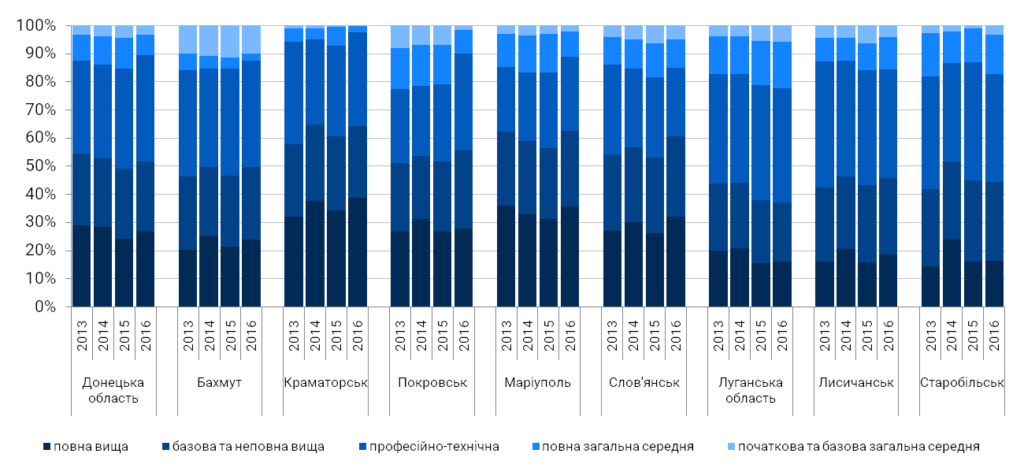
Table 1. The correspondence of demand and supply of the most sought-after professions (according to the content analysis of the job search sites).
| City | Group of professions | The structure of vacancies | CVs structure | CVs per one vacancy |
| Bakhmut | Sales Managers | 41% | 19% | 2.7 |
| Top managers, executives | 9% | 6% | 3.7 | |
| Teachers, instructors | 9% | 4% | 2.3 | |
| Kramatorsk | Sales Managers | 7% | 9% | 5.6 |
| Top managers, executives | 9% | 6% | 3.7 | |
| Accountants | 5% | 4% | 4.1 | |
| Cashiers | 5% | 3% | 2.7 | |
| Pokrovsk | Sales Managers | 33% | 28% | 3.8 |
| Accountants | 9% | 7% | 3.2 | |
| Cashiers | 9% | 3% | 1.4 | |
| Mariupol | Sales Managers | 23% | 19% | 3.6 |
| Client Work Specialists, administrators | 5% | 6% | 5.2 | |
| Top managers, executives | 5% | 10% | 9.2 | |
| Sloviansk | Sales Managers | 26% | 15% | 2.6 |
| Accountants | 8% | 5% | 2.7 | |
| Drivers | 7% | 8% | 5.4 | |
| Lysychansk | Sales Managers | 25% | 15% | 6.0 |
| Pharmacist, Chemist | 17% | - | - | |
| PC Collectors | 17% | - | - | |
| Starobilsk | Cashiers | 3% | 7% | 0.7 |
| Engineers | 22% | - | - | |
| Sales Managers | 22% | 30% | 4.0 |